
Republic Bank made TT$2.45 billion in total net profit for the year ended September 30, 2025, TT$2.20 billion of that belongs to RFHL shareholders, the rest to minority partners in its subsidiaries. Total revenue (lending plus fees and other income) reached TT$7.72 billion; the bank’s balance sheet crossed TT$127 billion across 16 territories from Trinidad and Tobago to Ghana, Guyana to the Cayman Islands. For every share owned, the bank earned TT$13.44.
SECTION 02 — INTRODUCTION
This annual report summary reads Republic Bank’s FY2025 results straight from the Group’s own filings: it crossed TT$127 billion on its balance sheet, raised its dividend in every year from FY2021 to FY2025, and announced a change of Chairman three months before the annual report was filed.

Caribbean banks reported their financial-year results in late 2025 against an interest-rate environment that did not move all year. The Central Bank of Trinidad and Tobago, the country’s banking regulator, held its repo rate (the rate it charges banks to borrow short-term) at 3.50% through every Monetary Policy Committee meeting from June 2025 to March 2026. It cited two reasons: inflation in T&T continued to slow through October 2025, and the country’s real GDP contracted in the first quarter of 2025. Beyond the region, meanwhile, the International Monetary Fund projected global economic growth of 3.2% in 2025, a touch below the 3.3% recorded in 2024.
Republic Bank operates in 16 territories across the Caribbean, South America, and West Africa, through nine banking subsidiaries that together employ 7,293 people, run 126 branches, and operate 377 ATMs. In FY2025 (year ended September 30, 2025), the Group made TT$2.45 billion in total net profit, up from TT$2.27 billion the year before, an increase of TT$176 million or 7.7% on TT$7.72 billion in total revenue, itself up from TT$7.17 billion, an increase of TT$552 million, also 7.7%.
For every $100 the Group earned in revenue, $70.78 came from lending (the difference between interest charged to borrowers and interest paid to depositors), and the remaining $29.22 came from fees, foreign exchange, and other services. Its parent-level capital ratio under T&T’s Basel II banking rules was 14.88%, meaning it held $14.88 in capital for every $100 of risk-weighted loans above the $12.50 the regulator requires. In short, this analysis walks through the six universal metrics that show how much money the bank made and kept, the six banking-specific metrics that matter for diversified banks, the three-year revenue and profit trajectory, the geographic and business-segment mix across 16 territories, and three watch items disclosed in the Group’s most recent public filings.


Source: Balance sheet total, AR 2025 page 14. Five-year dividend trend, AR 2025 page 14 and page 24. Chairman change, Q1 FY2026 press release (29 Jan 2026).
Source: CBTT Monetary Policy Reports May 2025 + May 2026; Monetary Policy Announcements June, September, December 2025, March 2026 (central-bank.org.tt). IMF projection cited in CBTT March 2026 announcement.
Source: AR 2025 pages 8–9 (territory and operational footprint); page 14 (5-Year Summary); page 112 (Income Statement); pages 36–47 (CEO Discussion).
SECTION 03 — COMPANY SNAPSHOT
What this company does

Ticker
RFHL – TTSE
Share Price
TT$107.96 · June 18, 2026
Sector
Banking
Operations
16 countries across the Caribbean
Market Cap
TT$17.6 billion
Fiscal Year End
September 30, 2025
Republic Bank is a Trinidad-headquartered banking group that operates across 16 countries in the Caribbean, South America, and West Africa.
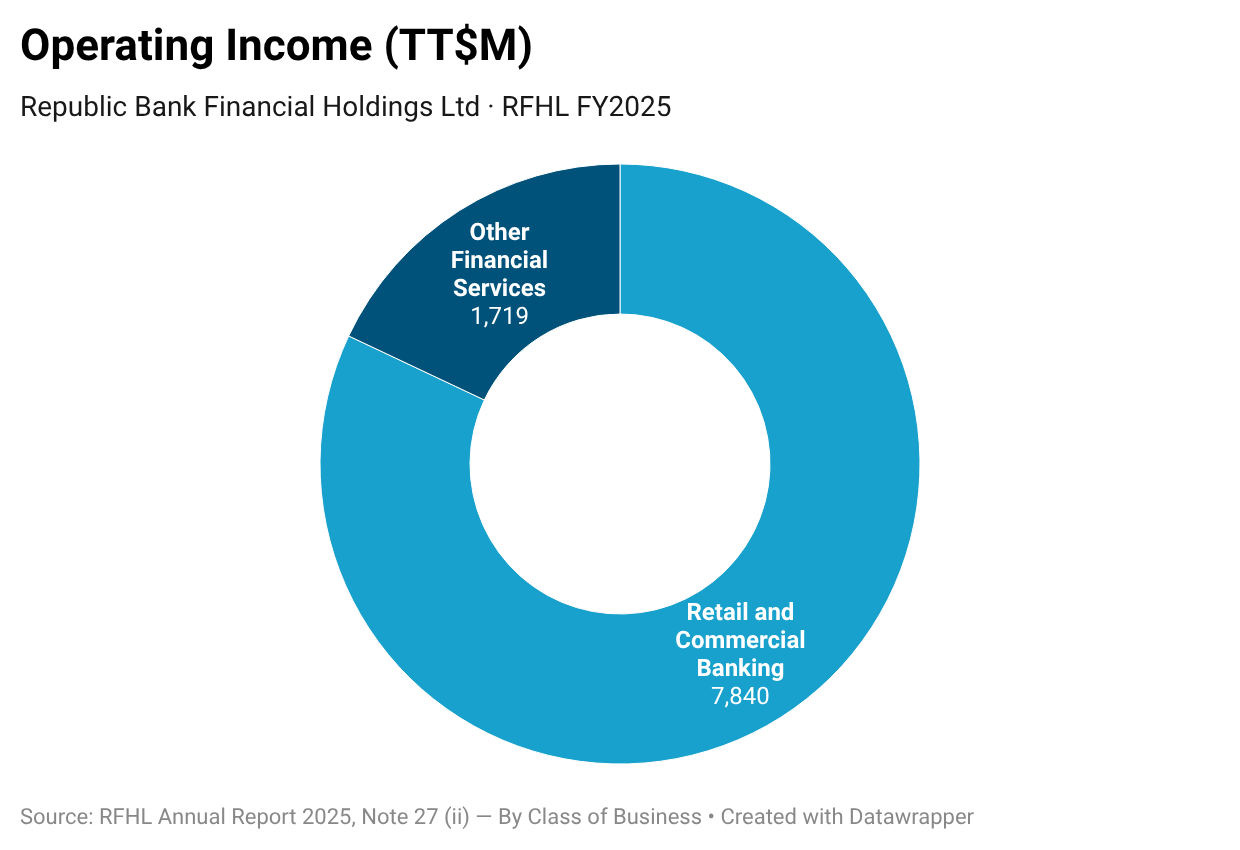
Its business is organised into two parts: Retail and Commercial Banking (which generated TT$7.84 billion of FY2025 revenue, or 82% of the total before internal-sales adjustments) and Other Financial Services (TT$1.72 billion, or 18%).
The nine banking subsidiaries include Republic Bank Limited (Trinidad and Tobago), Republic Bank (Guyana), Republic Bank (Barbados), Republic Bank (EC) covering the Eastern Caribbean, Republic Bank (Suriname), Republic Bank (Ghana), Republic Bank (BVI), Republic Bank (Grenada), and Cayman National Corporation.
In August 2025, the Group increased its ownership of Cayman National to 86.91%. Republic Bank’s shares trade on the Trinidad and Tobago Stock Exchange under the ticker RFHL.
Source: AR 2025 Note 27 pages 192–194 (segment composition); pages 8–9 (named subsidiaries); page 46 (Cayman National Corporation acquisition).
SECTION 04 — OWNERSHIP & GOVERNANCE
Who owns and runs this company
29.92%
18.81%
7.06%
Source: AR 2025 page 25 (10 Largest Shareholders).
15
Yashmid Karamath
Nigel M. Baptiste
Source: AR 2025 page 13 + Q1 FY2026 press release.
Ernst & Young
Trinidad and Tobago
Unqualified
Source: AR 2025 pages 102–107 (Independent Auditor’s Report) + page 25 (Directors’ Report. Auditor re-appointment resolution).
192,304 shares
0.12%
561,000 shares
TT$6.00 per share
TT$5.70 per share
+5.3%
163,833,584
163,238,000
None disclosed
EXPLORE THE DETAILS
Top 10 shareholders
| # | Shareholder | Shares Owned | % |
|---|---|---|---|
| 1 | National Investment Fund Holding Company Limited | 49,021,779 | 29.92% |
| 2 | National Insurance Board | 30,811,955 | 18.81% |
| 3 | Trintrust Limited | 11,563,255 | 7.06% |
| 4 | Republic Bank Limited | 7,983,388 | 4.87% |
| 5 | RBC Trust (Trinidad & Tobago) Limited | 4,631,790 | 2.83% |
| 6 | Trinidad and Tobago Unit Trust Corporation | 4,517,279 | 2.76% |
| 7 | Corporation Sole | 4,430,161 | 2.70% |
| 8 | First Citizens Depository Services Limited | 4,239,613 | 2.59% |
| 9 | Guardian Life of the Caribbean Limited | 2,771,279 | 1.69% |
| 10 | Tatil Life Assurance Limited | 1,952,417 | 1.19% |
| Top 10 Total | 121,922,916 | 74.42% | |
Full board composition — 17 directors
| Director | Role | Personal Shares |
|---|---|---|
| Yashmid Karamath | Chairman (appointed Oct 14, 2025; confirmed Chairman Jan 2026) | — |
| Nigel M. Baptiste | Group President & CEO (since 2016) | 32,778 |
| Vincent A. Pereira | Former Chairman (stepped down post-AR) | 14,991 |
| Ian L. Benjamin, SC | Director · Audit · Governance & Nomination | 667 |
| Dawn V. Callender | Director · Audit · Governance & Nomination | 1,000 |
| Jason K. Mootoo, SC | Director · Enterprise Risk | — |
| Michael A. Noel | Director · Enterprise Risk · Audit | — |
| Robert B. Riley | Director · Chair, Enterprise Risk | — |
| Colin A. Soo Ping Chow | Director · Chair, Audit | — |
| Richard R. Wickham | Director · Enterprise Risk | — |
| Kimberly G. Erriah-Ali | Corporate Secretary | 8,590 |
| Dr. Timothy Affonso | Director (appointed Oct 14, 2025) | — |
| Nalini Bansee | Director (appointed Oct 14, 2025) | — |
| Marsha A. Mc Leod-Marshall | Director | 5,241 |
| P. Vic Salickram | Director | 23,548 |
| Hamant Lalla | Director | 11,573 |
| Karen T. Yip Chuck | Director | 55,050 |
| Richard S. Sammy | Director | 6,905 |
| Karen Tom Yew | Chief Risk Officer | 8,896 |
Three changes occurred post-AR 2025 filing: Waltnel Sosa resigned Oct 4, 2025; Shameer Mohammed resigned Oct 7, 2025; Mark Loquan passed away. Yashmid Karamath, Dr. Timothy Affonso, and Nalini Bansee were appointed Oct 14, 2025 to fill the vacancies. Kristine Thompson retired and did not stand for re-election at the Dec 15, 2025 AGM.
Dividend history — last 5 years
| Year | Dividend per Share | Total declared for the year (TT$M) | Change vs Year Before |
|---|---|---|---|
| FY2021 | TT$4.00 | 654 | — |
| FY2022 | TT$4.50 | 736 | +12.5% |
| FY2023 | TT$5.20 | 851 | +15.6% |
| FY2024 | TT$5.70 | 933 | +9.6% |
| FY2025 | TT$6.00 | 983 | +5.3% |
| 5-Year Total | TT$25.40 | 4,157 |
Five consecutive years of dividend increases. The FY2025 TT$6.00 was paid out in four instalments across the year: TT$0.55 in February, TT$0.60 in May, TT$1.00 in August, and TT$3.85 (the year-end “final” dividend) declared on 7 November 2025. So far in FY2026, RFHL has paid TT$1.15 in dividends (TT$0.55 + TT$0.60) — exactly matching the same point last year.
Source: Republic Financial Holdings Limited Annual Report 2025, filed with TTSE · November 2025 · Corporate Information page 13, Directors’ Report pages 24–25, 10 Largest Shareholders page 25, Independent Auditor’s Report pages 102–107.
SECTION 05 — HOW TO READ THIS
New to reading company results?
How to read this analysis? Information for first-time investors.
This analysis covers Republic Financial Holdings across thirteen sections — each one designed to serve a different question you might have about the company.
Sections one through three give you the headline: the hook stat, the editorial framing, and the company’s basic identity. Read these and you have the gist of the story.
Section four shows you who owns and runs the company — top shareholders, board composition, auditor, and dividend history. The three “Explore the details” toggles beneath the main cards expand to show the full top ten shareholders, every director, and a five-year dividend history. Tap them open only if you want that depth.
Section six gives you the macro context — what was happening in the sector and the wider economy during the reporting period.
Sections seven and eight are the heart of the analysis. Section seven shows six universal metrics (revenue, net profit, earnings per share, return on equity, dividend per share, P/E ratio) that apply to every company. Section eight shows six sector-specific metrics that matter for this kind of business — for a bank, that means capital adequacy, non-performing loans, and similar regulatory measures. Each card carries a colour-coded badge: lime for improvement, grey for stable, amber for decline.
Section nine shows the three-year trend chart. Section ten shows where the company earns its revenue — by geography and by business segment. Section eleven contains expandable definitions for the finance terms used throughout. Tap any term to expand its plain-English explanation.
Section twelve names three factors disclosed in public filings that will shape the next reporting period — these are sourced disclosures, not predictions.
Section thirteen is the Ambition summary — a plain-English restatement of what the analysis shows.
You do not need to read this in order. Jump to the section that answers your question.
SECTION 06 — MARKET CONTEXT
What was happening around this company
HOW CARIBBEAN BANKS COMPARED
Caribbean banking groups that reported financial year results in late 2025.
Republic Bank’s 15.01% return on equity in FY2025 (up from 14.80% the year before) sits within that range. The bank’s parent-level capital ratio of 14.88% under T&T’s Basel II rules meaning $14.88 in capital for every $100 of risk-weighted loans, also sits above the 12.5% minimum that every commercial bank operating in Trinidad and Tobago must meet.
Source: RFHL Annual Report 2025 · pages 14 and 46
WHAT THE CENTRAL BANK DID
The Central Bank of Trinidad and Tobago, kept its repo rate at 3.50% at every Monetary Policy Committee meeting since March 2020, including March 2026.
The repo rate is what the central bank charges commercial banks like Republic to borrow short-term. The Central Bank cited slowing inflation through October 2025 and a contraction in T&T’s real GDP in the first quarter of 2025 as reasons for holding rates steady.
In its March 2026 announcement, the Central Bank also flagged disruptions to global trade, energy-price spikes, and unsettled financial markets following the late-February escalation of tensions involving the United States, Israel, and Iran.
Source: CBTT Monetary Policy Announcement March 2026 · Monetary Policy Report May 2026 · central-bank.org.tt
GUYANA & CAYMAN GROWTH
The Republic Bank subsidiaries based in Guyana and the Cayman Islands continued to generate higher revenue growth in FY2025 than the Group’s core domestic markets.
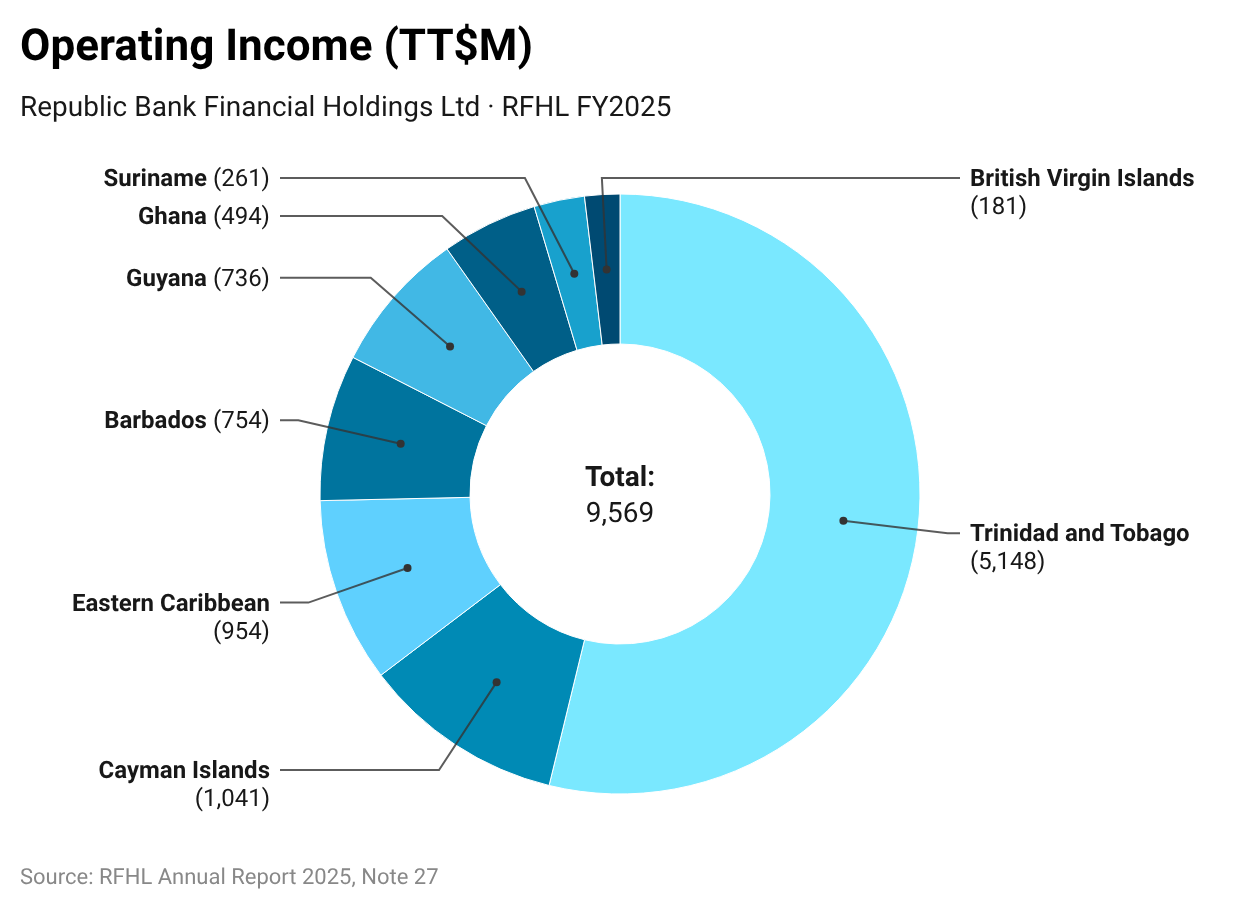
Republic Bank (Guyana) Limited generated TT$736 million in operating income (9.5% of the Group’s total before adjusting for internal sales between subsidiaries); the Cayman Islands operations generated TT$1.04 billion (13.5%) both larger contributions than Barbados (TT$754 million, 9.8%) or the Eastern Caribbean (TT$954 million, 12.3%).
Source: RFHL Annual Report 2025 · Note 27 Segmental Information · pages 193-194
SECTION 07 — THE NUMBERS THAT MATTER
Six figures that define this company
Source: AR 2025 page 112 (Consolidated Statement of Income); AR 2024 page 90 (FY2023 restated comparative).
Source: AR 2025 page 112; AR 2024 page 90 (FY2023 restated); AR 2025 page 14 (5-Year Summary for FY2021–2022).
Source: AR 2025 page 112
Source: RFHL Annual Report 2025 · Consolidated Statement of Income (page 112) · Consolidated Statement of Financial Position (pages 110–111) · 5-Year Consolidated Financial Summary (page 14) · RFHL Annual Report 2024 page 90 (FY2023 restated comparative).
SECTION 08 — BANKING-SPECIFIC METRICS
The indicators that matter for banks
Source: RFHL Annual Report 2025 · Group President & CEO’s Discussion and Analysis (pages 36–47) · Consolidated Statements of Income and Financial Position (pages 110–112) · 5-Year Consolidated Financial Summary (page 14).
BANKING TERMS EXPLAINED
Basel III
Basel III is the international rulebook for how much capital banks must keep in reserve to absorb losses without failing. It was written after the 2008 global financial crisis, when several large banks ran out of capital and had to be rescued by their governments. The rulebook is named after the Swiss city where the international committee that drafts it meets.
Trinidad and Tobago’s banking regulator (the Central Bank of T&T) currently uses Basel II, the previous version of the rulebook rather than Basel III. Under Basel II, every bank operating in T&T must hold at least $12.50 in capital for every $100 of risk-weighted loans on its books. RFHL’s 14.88% capital ratio sits above that minimum.
Different countries that RFHL operates in use different versions. Seven of the Group’s subsidiaries (Trinidad and Tobago, Barbados, Ghana, Cayman, Guyana, Grenada, and the Eastern Caribbean) report under Basel II. Three (Suriname, Atlantic Financial, and the British Virgin Islands) still report under Basel I, an even earlier version. None of the Group’s nine subsidiaries currently report under Basel III.
Risk-Weighted Assets
Not all loans carry the same risk of going bad. A residential mortgage to a creditworthy homeowner is much safer than an unsecured business loan; cash held by the bank and government bonds carry close to zero risk. “Risk-weighted assets” is a calculation that adjusts the bank’s total assets for these differences, assigning a percentage weight to each asset class based on how risky it is. Safer assets get a lower weight; riskier assets get a higher weight.
Capital ratios like RFHL’s 14.88% are expressed as a percentage of risk-weighted assets rather than as a percentage of total assets. The reason: requiring banks to hold capital against riskier loans (at a higher rate) than safer loans (at a lower rate) gives the rule its teeth. A bank can hold a lot of safe government bonds without tying up much capital; the same dollar amount in unsecured lending would require significantly more capital backing.
Under the Basel II rules applied in T&T, banks must hold at least $4.50 in core capital (called CET1) for every $100 of risk-weighted assets, at least $6.00 in higher-quality capital combined (called Tier 1), and at least $12.50 in total capital (Tier 1 plus Tier 2).
Interest Earning Assets
Not every asset on a bank’s balance sheet earns interest. Branches, computer systems, intangibles, and operational cash held in tills don’t generate interest income, they’re necessary to run the business but they don’t pay the bank anything. Only loans, investment securities (like bonds), and short-term placements with other banks earn interest.
“Interest-earning assets” measures the average balance of just the interest-earning portion of the bank’s balance sheet during the year and it’s the denominator used to calculate the interest margin. RFHL’s interest margin of 4.45% in FY2025 was calculated against an interest-earning asset base that grew by TT$7.1 billion (6.1%) year-on-year. Over the same period, the bank’s net interest income grew by 7.8% to TT$5.46 billion meaning the bank earned slightly more interest income for each dollar of interest-earning assets in FY2025 than in FY2024.
Return on Assets (ROA)
Return on assets tells you how much profit a business generates for every dollar on its balance sheet. For most businesses, return on assets is a high single-digit or low double-digit percentage, a successful retailer or manufacturer might earn $8 to $15 in profit for every $100 of assets it owns.
Banks look very different. Because a bank’s primary asset is its loan book and lending operates on much larger asset bases relative to revenue, banking returns on assets are structurally lower than corporate returns. Return on assets shows profit per $100 of everything the bank owns. At 1.99%, RFHL earned about TT$1.99 for every TT$100 of assets in FY2025. RFHL’s $1.99 per $100 in FY2025 (up from $1.96 in FY2024 and $1.35 in FY2021) sits comfortably within that range.
For Net Interest Income, P/E Ratio, ROE, EPS, and Debt-to-Equity Ratio — see Section 11 (Key Terms Explained).
SECTION 09 — REVENUE & PROFIT STORY
The three-year trend
Republic Bank’s total net profit grew 27% over two years from TT$1.93 billion in FY2023 to TT$2.45 billion in FY2025, while total revenue grew 15% over the same period.
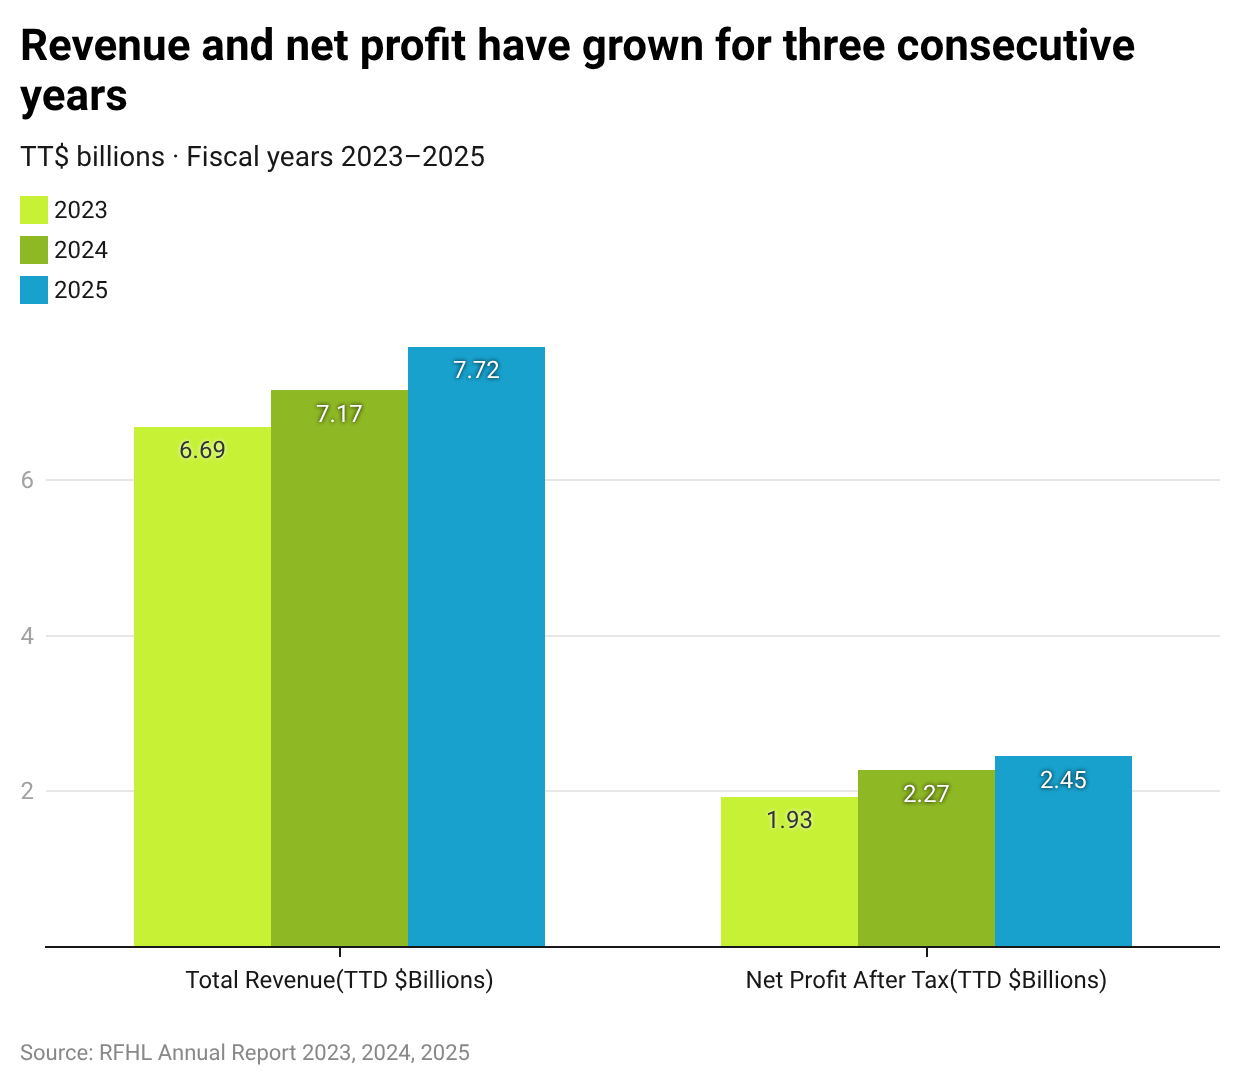
Republic Bank’s profit attributable to shareholders has risen every year from FY2021 to FY2025. Total revenue (lending plus fees and other income) grew from TT$6.69 billion in FY2023 (restated) to TT$7.72 billion in FY2025, an aggregate increase of TT$1.03 billion, or 15.3%, over two years. Over the same period, total net profit grew from TT$1.93 billion to TT$2.45 billion, an increase of TT$516 million, or 26.7%. The profit slice attributable to RFHL shareholders specifically rose from TT$1.75 billion (FY2023) to TT$2.20 billion (FY2025), a 25.8% cumulative increase, while the slice attributable to minority partners grew from TT$182 million to TT$246 million.
Two more recent results announcements show the pattern continuing into FY2026. In the three months to December 31, 2025, RFHL reported profit attributable to shareholders of TT$595.7 million, up 8.9% from the same quarter the year before. Then, in the six months to March 31, 2026, the Group reported profit attributable of TT$1.07 billion, up 5.4%, and total assets of TT$133.7 billion.
SECTION 10 — WHERE THE REVENUE COMES FROM
Geographic and business segment breakdown
GEOGRAPHIC REVENUE MIX
GEOGRAPHIC REVENUE MIX
Source: RFHL Annual Report 2025, Note 27 — Segment Information
BUSINESS SEGMENT MIX
Source: RFHL Annual Report 2025, Note 32 — Segment Information
RFHL’s revenue is most heavily concentrated in Trinidad and Tobago, which contributes 53.8% of the group’s gross operating income, the largest single market. The Cayman Islands and Eastern Caribbean operations together add another 20.9%, with Barbados, Guyana, and Ghana contributing single-digit shares. Suriname and the British Virgin Islands round out the eight reporting segments, which together cover 16 territories.
By business activity, RFHL reports under two segments. Retail and Commercial Banking, the dominant 82.0%, covers deposit-taking, residential mortgages, personal and business loans, credit cards, and corporate lending across the group’s subsidiary banks including Republic Bank Limited in Trinidad, Republic Bank (Guyana), Republic Bank (Barbados), Republic Bank (Ghana), Cayman National Corporation, and Republic Bank (EC) Limited.
Other Financial Services, the remaining 18.0% includes Republic Wealth Management Limited (asset management and investment funds), Republic Life Insurance Company Limited (life insurance, established 2021), Republic Caribbean Investments (investment banking), and Group Treasury operations. This concentration in traditional banking is typical for Caribbean banking groups, where deposit-taking and commercial lending remain the dominant revenue engines.
SECTION 11 — KEY TERMS EXPLAINED
Unfamiliar with a term? Tap to expand
Net Interest Income
A bank earns money by charging borrowers more interest than it pays depositors.
If the bank pays you 2% on your savings account but charges a mortgage customer 7%, that 5% gap multiplied across billions of dollars in loans is net interest income.
It is a bank’s primary source of revenue.
P/E Ratio
The price-to-earnings ratio compares a company’s share price to its annual earnings per share. If a company with a share price of $100 and earnings per share of $10 has a P/E of 10x. meaning investors are paying $10 for every $1 of annual earnings.
Lower P/E values are often associated with mature companies; higher P/E values with companies investors expect to grow earnings significantly.
Return on Equity (ROE)
Return on equity measures how much profit a company generates from the money shareholders have invested in it. If shareholders have put TT$100 into the company and the company earns TT$14.80 in annual profit, the ROE is 14.8%.
It is one of the most common measures of how efficiently a company uses shareholder capital. A bank’s ROE is typically compared to other banks, not to companies in different sectors.
Earnings per Share
Earnings per share is the total annual profit of a company divided by the number of shares outstanding. If a company earns $1 million in profit and has 1 million shares, the EPS is $1.00
EPS shows what each individual share represents in profit terms. It is the building block for other ratios, most importantly the P/E ratio, which divides the share price by EPS.
Debt-to-Equity Ratio
The debt-to-equity ratio compares how much a company has borrowed against how much shareholders have invested. A ratio of 1.4× means the company owes TT$1.40 for every TT$1 of shareholder equity.
Different industries operate at different debt levels, banks typically run higher debt ratios than retailers because lending money is part of their business model. The ratio is most useful when compared to companies in the same sector.
SECTION 12 — WHAT TO WATCH
Three things to watch in the next reporting period
SECTION 13 — THE AMBITION SUMMARY
What this analysis shows
Republic Bank made TT$2.45 billion in total net profit for the year ended September 30, 2025, up from TT$2.27 billion the year before, an increase of TT$176 million or 7.7%. Of that total, TT$2.20 billion belongs to RFHL shareholders directly; the remaining TT$246 million belongs to minority partners in subsidiaries the Group doesn’t fully own. Total revenue (lending plus fees and other income) reached TT$7.72 billion, also up 7.7%, an increase of TT$552 million over FY2024’s TT$7.17 billion.
Per share, the Group earned TT$13.44, up from TT$12.25 the year before and generated a return on shareholder capital of 15.01%. Its parent-level capital ratio of 14.88% sits above the 12.5% minimum required by Trinidad and Tobago’s banking regulator. Across its 16 territories, the balance sheet crossed TT$127 billion, with Trinidad and Tobago contributing 53.8% of revenue, the Cayman Islands 10.9%, the Eastern Caribbean 10.0%, and Barbados, Guyana, Ghana, Suriname, and the British Virgin Islands together contributing 25.4%.
What this analysis shows is that Republic Bank’s FY2025 results were anchored to five visible patterns: dividend increases in every year from FY2021 to FY2025, taking the annual payout from TT$4.00 per share in FY2021 to TT$6.00 in FY2025; return on equity higher in every year from FY2021 to FY2025, from 11.87% in FY2021 to 15.01% in FY2025; the August 2025 purchase of an additional 11.92% of Cayman National Corporation, raising RFHL’s ownership stake there to 86.91%; a Chairman change that took place between the November 2025 annual report filing and the January 2026 Q1 results announcement; and Half-Year FY2026 profit growth of 5.4% reported on 30 April 2026, by which point the bank’s balance sheet had reached TT$133.7 billion.
Caribbean financial education, every Tuesday.
Plain language. Sourced data. No investment advice. Unsubscribe any time.
SOURCES
- RFHL · 2025 Annual Report
- CBTT · Mar 2026 announcement
- CBTT Monetary Policy · June 2020 Announcement
Frequently Asked Questions (FAQs)
What does Republic Financial Holdings Limited (RFHL) do?
RFHL, known as Republic Bank, is a Trinidad-headquartered banking group listed on the Trinidad and Tobago Stock Exchange under ticker RFHL. It operates across 16 territories in the Caribbean, South America, and West Africa through nine banking subsidiaries.
What were RFHL's FY2025 total revenue and net profit?
For the year ended September 30, 2025, RFHL reported total revenue of TT$7.72 billion and total net profit after taxation of TT$2.45 billion, each up 7.7% on FY2024. Source: RFHL Annual Report 2025, page 112.
Does RFHL pay a dividend?
RFHL declared total dividends of TT$6.00 per share for FY2025, up 5.3% and its fifth consecutive annual increase from TT$4.00 in FY2021. Source: RFHL Annual Report 2025.
Is this RFHL stock analysis a recommendation to buy the shares?
No. Ambition reports what the data shows and explains what it means. It does not recommend buying, selling, or holding, and does not predict share-price movements. This is financial education, not investment advice. Always consult a qualified financial advisor.
Where does the data in this analysis come from?
Every figure is sourced from RFHL’s own published filings, the FY2025, FY2024, and FY2023 Annual Reports and financial statements filed with the Trinidad and Tobago Stock Exchange (TTSE).
From Ambition · Courses & Tools
Take Control of Your Money
The foundation every financial decision rests on
See the course →Read more...

Four Markets. One Pattern.
Caribbean financial literacy across four markets: the programs in Trinidad and Tobago, Jamaica, Guyana and Barbados, and what the published data shows.

Ansa Mcal (AMCL) Annual Report Summary 2025
ANSA McAL FY2025 stock analysis on the TTSE. Profit before tax crosses TT$1.01 billion for the first time; three-year dividend pause funds the 2X strategy.

Why Should I Buy Local?
Why Should I Buy Local? AMBITION | Business...
This analysis is financial education only, not investment advice. Ambition holds no position in any company analysed and has no commercial relationship with the companies featured unless explicitly disclosed. Past financial performance does not indicate future results. Data is sourced from publicly available company filings and exchange reports. Always consult a qualified financial advisor before making any investment decision.